PORTFOLIORESEARCH AND TEACHING
.01

ABOUT

WORK
4306 Woodland Ave, Philadelphia, PA 19104
mapiconimg
asaghafi@sju.edu
215-596-7240
Patterns and forms surround us and I enjoy discovering them using the language of statistics. As an Associate Professor of Statistics & Data Science at Saint Joseph University, my research revolves around Machine Learning, Deep Learning, Classification of Non-Stationary Signals, Par/Non-par/Bayesian Analysis and Modeling.

BIO

ABOUT ME

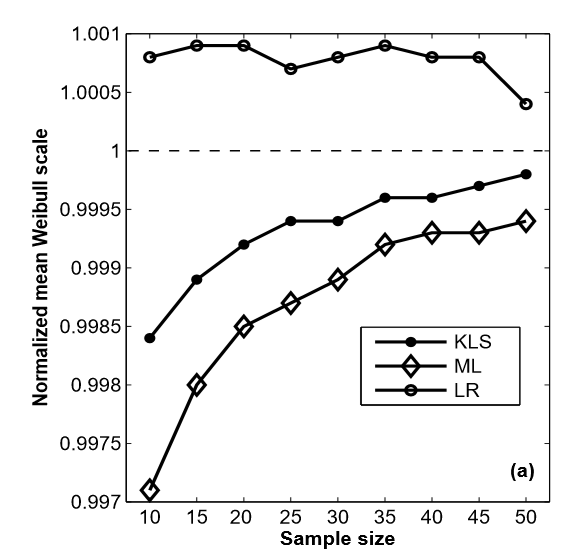
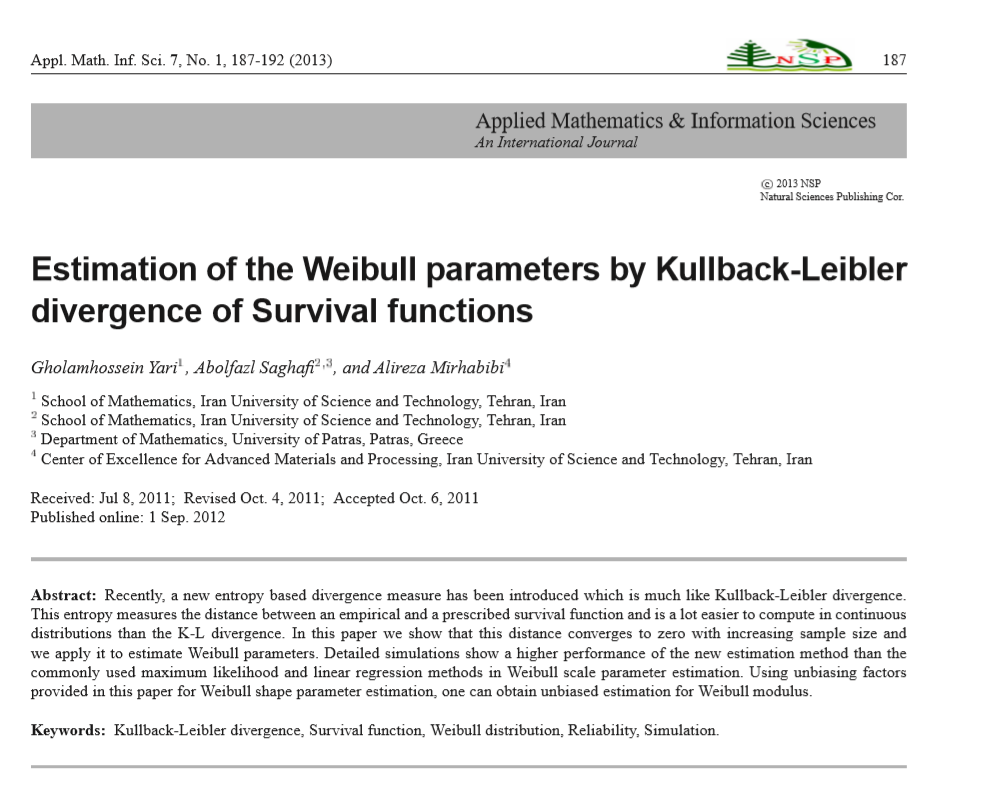
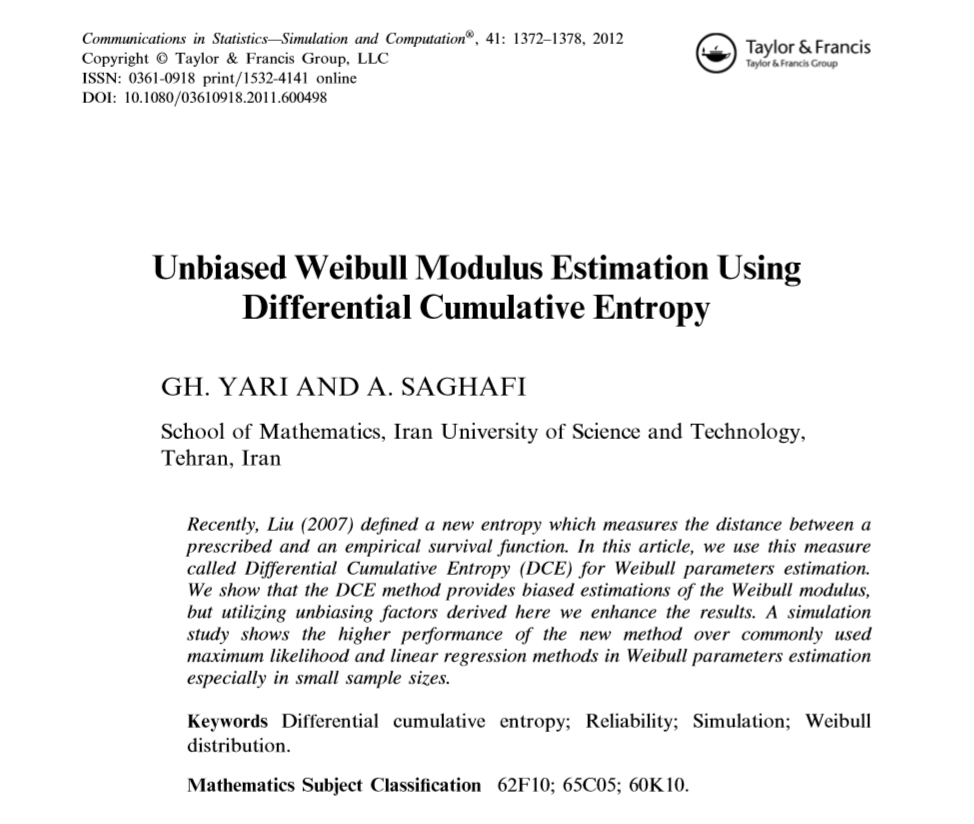
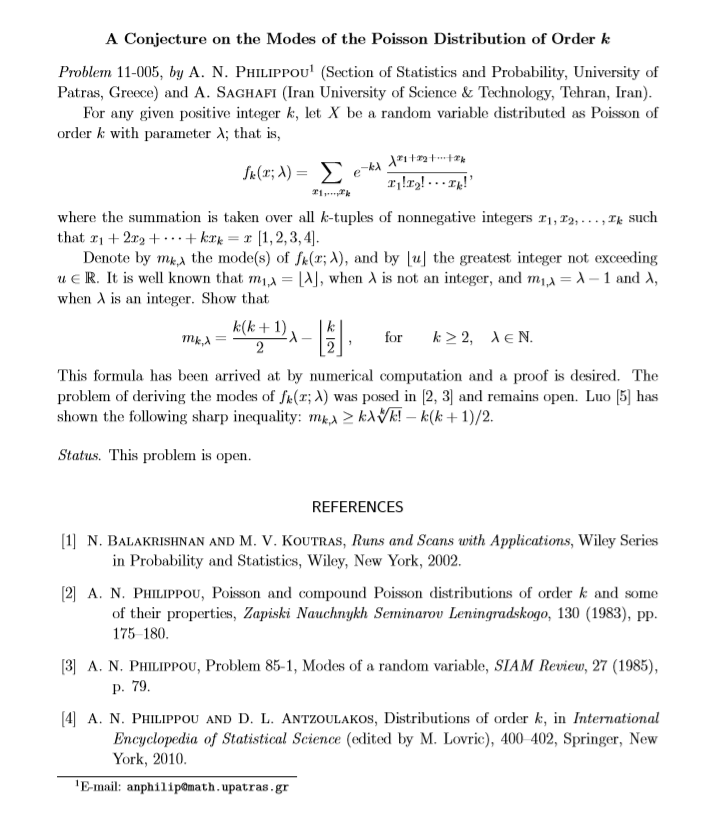
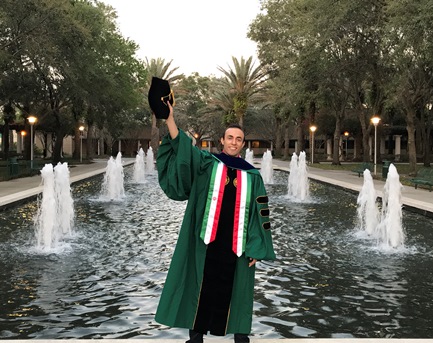
I earned my Ph.D. in Applied Mathematics from Iran University of Science and Technology where I specialized on Divergence Measures, Entropy, Weibull and Order k Poisson Models. Further, I earned my 2nd Ph.D. in Statistics from University of South Florida focusing on Machine Learning, Time Series Classification, and BIG Data Analytic. I am currently an Associate Professor at Saint Joseph's University in Philadelphia and Vice-President of International Affairs at International Federation for Nonlinear Analysts (IFNA).

HOBBIES

LOVES

Everything about masterpieces of ancient Greek literature amazes me. Love reading Plato's praise of Socrates, the greatest thinker of all time, through his dialogues.

Greek mythology fascinates me. Can't have enough of Greek comedy and tragedy. Listening to the audio lectures of Elizabeth Vandiver on Iliad and Odyssey takes me to another dimension where Gods were ruling and heroes were making history.

ACTIVITIES

LIKES

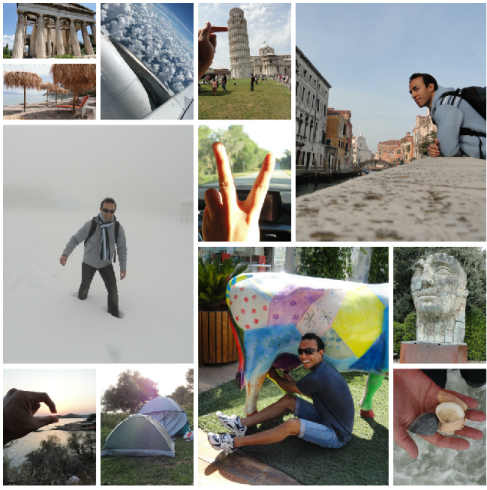
I love that spontaneous feeling that fires inside me when I gaze at breathtaking spots, I reach out my camera to freeze the time and capture a memorable vision, but no camera is as good the eyes and no moment is the same as now.

Been to France (Paris), Italy (Rome, Florence, Pisa, Venice), Armenia (Yerevan), Greece (Athens, Patras, Sparta, Epidavros, Corinth, Nafplio, Mistras, Monemvasia, Ariopoli, Pyrgos, Mycenae).

CRAZY

FUN

Coding is fun, it has entertained me ever since I started coding Pascal in high school. I have always been fascinated by robots especially robot fights. Long story short, I purchased this PiCar from Amazon and put it together. It works perfectly! I am now building one from scratch myself utilizing a NanoPC. I have so many ideas in mind, too bad it's sort of expensive to buy parts for these type of lets say research lol

.02

RESEARCH

TOP COLLABORATORS

Dr. Chris P. Tsokos

Distinguuished Professor

Dr. Sajad Jazayeri

Geoscientist

Dr. Gholamhossein Yari

Professor of Statistics

Dr. Andreas Philippou

Professor Emeritus

RESEARCH PROJECTS

Modeling Fracture Strength of Ceramic Tiles

DESCRIPTION

Utilizing Weibull distribution and developing a statistical technique to detect multiple flaw distributions. Further, estimating parameters of multiple Weibull distributions.

We show that the Kullback-Leibler Divergence of Survival Functions converges to zero with increasing sample size and utilized that to develop a new technique in estimating Weibull distribution parameters. Detailed simulations show improved performance of the new estimation method compared to commonly used maximum likelihood and linear regression methods in Weibull scale parameter estimation.

We published the results in peer-reviewed journals and presented them in a number of conferences.

Investigating the Modes of Order k Poisson Distribution

DESCRIPTION

The problem of deriving the modes of the Poisson distribution of order k was posed by Philippou (1983) and Philippou (1985) but remained open due to complexity. In 2011, using simulations and pattern recognition, we proposed a closed formula for the modes of the Poisson distribution of order k.

In 2013, we mathematically proved our stated conjecture and established a lower bound for the modes of the Poisson distribution of order k, for k=2,3,4,5. Thus, solving partially an open problem since 1983.

Internet Addiction in Iranian Adolescents

DESCRIPTION

Analyzing results of multiple questionnaires including Young’s IA test, the General Health Questionnaire (GHQ), and family relationship questionnaires on a national level, we stated factors that could play an important role in Internet addiction among Iranian high school and secondary school adolescents.

The findings of this study could help parents, school counselors, and teachers to pay more attention to excessive Internet use in adolescents and propose possible solutions.

Eye State Change Detection in Real-Time using Brain Signals

DESCRIPTION

Detecting eye states has many applications including classification of sleep-waking states in infants or hospitalized patients, detection of driving drowsiness where it estimated to be responsible for at least 72,000 crashes, 44,000 injuries, and 800 deaths in 2013, human-computer interface design, alertness of pilots especially fighter jet pilots, and stress feature identification, among others.

Machine learning analytics addressing this problem require extensive train and prediction times which limit their potential application in real life. However, many problems do not require going through decision making using machine learning algorithms upfront.

We developed two state-of-the-art monitor and action process that detect eye state change fast and accurately while performing significantly better than alternatives. Results have been published in journals and analytics have been filed with the USPTO an a non-provisional patent.

Modeling Heredity effects on Parkinson’s Disease

DESCRIPTION

Hereditary is one of the key risk factors of the Parkinson’s disease (PD) and children of individuals with the Parkinson’s carry a two-fold risk for the disease. We estimate chance of developing the Parkinson’s disease for a given individual in five types of families. That is, families with negative history of the PD (I), families with positive history where neither one of the parents (II), one of the parents (III-IV), or both parents (V) are diagnosed with the disease.

It is extremely important knowing such probabilities as the individual can take precautionary measures to defy the odds. While many physicians have provided medical opinions on chance of developing the PD, our study is one of the first to provide statistical analysis with real data to support the conclusions.

Automatic Underground Object Detection

DESCRIPTION

Ground Penetrating Radar (GPR) is widely used in detecting buried objects including utility lines, tree roots, caves, landmines, grave sites, etc. Accurate depth estimation of the lateral object location depends on many factors. We proposed TWO statistical analytical monitoring schemes to detect burial site of objects and estimate their location and depth with high accuracy. The analytics run in real-time that is plausible for real-life applications.

Results are patented by the United States Patent and Trademark Office as the new analytics detect objects and estimate their location and depth with high accuracy, performing far better than anything currently on the market.

The developed analytics provide • Fully automated detection procedure • Warning the user prior to reaching buried objects • Accurate location and depth estimation of buried object • Detecting multiple buried objects • Fast run-time of the analytics plausible for on-site applications • Accurate performance even on noisy media

Optimizing Treatment of Complex Regional Pain Syndrome with Ketamine

DESCRIPTION

Developed a method that objectively measures the clinical benefits of ketamine infusions to treat Complex Regional Pain Syndrome (CRPS), thus making it possible, for the first time, to determine the optimal dosing of ketamine and duration of treatment to treat CRPS.

Our findings suggest that four days of treatment are sufficient for the treatment of CRPS of the lower extremities. For the upper extremities, more than four days may be required. Our study is the first to utilize quantitative sensory testing to direct the treatment of a chronic pain disorder.

Splice Junction Identification using sophisticated Machine Learning and Deep Learning Methods

DESCRIPTION

Developed an LSTM Neural Network that identifies whether a sequence of pre-mRNA is an Intron, Extron, or Neither. Results are published in the journal of Current Genomics. Codes are available on GitHub.

Deep Reinforced Learning in Molecular Design of Chemical Compounds

DESCRIPTION

I am currently working with a network of researchers to design chemical compounds with desired characteristics using Deep Reinforced Learning methods. We are developing proposals to seek funding.

.03

PUBLICATIONS

PUBLICATIONS LIST
11 Oct 2021

Splice Junction Identification using Long Short-Term Memory Neural Networks

https://doi.org/10.2174/1389202922666211011143008

Current Genomics

Journal Paper K. Regan, A. Saghafi, Z. Li

Splice Junction Identification using Long Short-Term Memory Neural Networks

K. Regan, A. Saghafi, Z. Li
Journal Paper
About The Publication
Background: Splice junctions are the key to going from pre-messenger RNA to mature messenger RNA in many multi-exon genes due to alternative splicing. Since the percentage of multi-exon genes that undergo alternative splicing is very high, identifying splice junctions is an attractive research topic with important implications. Objective: The aim is to develop a deep learning model capable of identifying splice junctions in RNA sequences using 13,666 unique sequences of primate RNA. Method: A Long Short-Term Memory (LSTM) Neural Network model is developed that classifies a given sequence as EI (Exon-Intron splice), IE (Intron-Exon splice), or N (No splice). The model is trained with groups of trinucleotides and its performance is tested using validation and test data to prevent bias. Results: Model performance was measured using accuracy and f-score in test data. The finalized model achieved an average accuracy of 91.34% with an average f-score of 91.36% over 50 runs. Conclusion: Comparisons show a highly competitive model to recent Convolutional Neural Network structures. The proposed LSTM model achieves the highest accuracy and f-score among published alternative LSTM structures. Keywords: Splice Junction, Deep Learning, Neural Networks, LSTM, RNA-seq, Classification
01 Apr 2020

Optimizing the Treatment of CRPS with Ketamine

https://doi.org/10.1097/AJP.0000000000000831

The Clinical Journal of Pain

Journal Paper A.F. Kirkpatrick, A. Saghafi, K. Yang, P. Qiu, J. Alexander, E. Bavry, R.J. Schwartzman

Optimizing the Treatment of CRPS with Ketamine

A.F. Kirkpatrick, A. Saghafi, K. Yang, P. Qiu, J. Alexander, E. Bavry, R.J. Schwartzman
Journal Paper
About The Publication
This study aimed to develop a method that objectively measures the clinical benefits of ketamine infusions to treat complex regional pain syndrome (CRPS), thus making it possible, for the first time, to determine the optimal dosing of ketamine and duration of treatment to treat CRPS. Our findings suggest that four days of treatment are sufficient for the treatment of CRPS of the lower extremities. For the upper extremities, more than four days may be required. Our study is the first to utilize quantitative sensory testing to direct the treatment of a chronic pain disorder. Keywords: Complex Regional Pain Syndrome, hyperalgesia, ketamine, pain thresholds, Reflex Sympathetic Dystrophy.
18 Oct 2019

Real-time anomaly detection using dynamic time warping of GPR signals

San Antonio, TX, USA

The Society of Exploration Geophysicists (SEG) International Exposition and 89th Annual Meeting, SEG19.

Conferences A. Saghafi, S. Jazayeri, S. Esmaeili, C.P. Tsokos

Real-time anomaly detection using dynamic time warping of GPR signals

A. Saghafi, S. Jazayeri, S. Esmaeili, C.P. Tsokos
Conferences
About The Publication
A novel statistical scheme is introduced that measures dissimilarity of GPR signals to signals from target-free locations using Dynamic Time Warping to detect potential burial sites ahead. Further, by investigating the potential burial sites and by pinpointing the arrival time of hyperbola apex, the soil velocity, location, and depth of multiple buried objects are estimated accurately. The computations run fast and could be performed in real-time without user’s interference. Keywords: common offset, ground-penetrating radar (GPR), statistics, signal processing, algorithm.
28 Mar 2019

Real-time object detection using Power Spectral Density of Ground Penetrating Radar Data

https://doi.org/10.1002/stc.2354

Structural Control and Health Monitoring, 26 (6).

Journal Paper A. Saghafi, S. Jazayeri, S. Esmaeili, C.P. Tsokos

Real-time object detection using Power Spectral Density of Ground Penetrating Radar Data

A. Saghafi, S. Jazayeri, S. Esmaeili, C.P. Tsokos
Journal Paper
About The Publication
A statistical analytical monitoring scheme is developed that utilizes maximum energy of ground-penetrating radar signals to detect hidden buried objects and estimate their location and depth automatically. The maximum energy is calculated for locations by Welch’s power spectral density estimation. Using the proposed analytic, the maximum energy is tightly monitored for a significant change from reference signals generated using target-free locations. A warning message is triggered when monitoring process detects a site with potential buried objects, on average, 90 cm (2.95 ft) away from the object for 800-MHz antenna. Continuing the ground-penetrating radar scan in the same direction and monitoring the signals, the procedure uses a sophisticated hyperbola mapping method to estimate the location and depth of buried objects with high accuracy. The analytics could successfully pinpoint the location and depth of hidden objects, respectively, with mean absolute error of 0.38 and 2.03cminsyntheticnoisyenvironments. Reliable performance of the proposed analytics in real cases that run in real-time for multiple object detection even in noisy media proves its efficiency for real-life exploration. Keywords: detection, ground‐penetrating radar, monitoring, power spectral density, sequential control process, utilities.
15 May 2019

Automatic object detection using Dynamic Time Warping on Ground Penetrating Radar signals

https://doi.org/10.1016/j.eswa.2018.12.057

Expert Systems with Applications, 122 (15) 102-107.

Journal Paper S. Jazayeri, A. Saghafi, S. Esmaeili, C.P. Tsokos

Automatic object detection using Dynamic Time Warping on Ground Penetrating Radar signals

S. Jazayeri, A. Saghafi, S. Esmaeili, C.P. Tsokos
Journal Paper
About The Publication
Ground Penetrating Radar (GPR) is a widely used non-destructive method in buried object detection. However, online, automatic, and accurate location and depth estimation methods using GPR are still under development. In this article, a cutting-edge expert system is proposed that compares signals from newly scanned locations to a target-free accumulated reference signal and computes a dissimilarity measure using Dynamic Time Warping (DTW). By setting a threshold on DTW values and monitoring them online, a significant deviation of the DTW values from the reference signal is detected prior to reaching an object. A potential burial site is therefore automatically detected without having a complete GPR scan which is a huge advantage compared to existing methods. Following the scanning process and investigating the potential burial site, location and depth of multiple buried objects is estimated automatically and highly accurate. The fully automated analytics eliminate the need of expert operators in estimating spatial burial locations and perform accurately even on noisy media. Statistical proofs are provided that support the validity of the developed expert system in theory. Moreover, the analytics run in real-time that is plausible for on-site applications. Keywords: Ground Penetrating Radar signals, Dynamic Time Warping, Sequential confidence intervals, Control process, Object detection.
08 Jan 2019

SYSTEMS AND METHODS FOR DETECTING BURIED OBJECTS

US 10,175,350 B1

A non-provisional patent granted by USPTO, issued on Jan 8, 2019. We developed state-of-the-art analytics to detect buried object ahead using Ground Penetrating Radar (GPR) signals captured at discrete locations along a surface of a medium and to estimate their location and depth in real-time with high accuracy. We are potentially looking for companies to invest in our technology.

Patent Selected A. Saghafi, S. Jazayeri, S. Esmaeili, C.P. Tsokos

SYSTEMS AND METHODS FOR DETECTING BURIED OBJECTS

A. Saghafi, S. Jazayeri, S. Esmaeili, C.P. Tsokos
Patent Selected
About The Publication
12 Apr 2022

MACHINE LEARNING ANALYTICS IN REAL TIME FOR HEALTH SERVICES

US11,298,071 B1

A non-provisional patent granted by USPTO on April 12, 2022. In this patent we developed analytic systems that detect state changes in time-series data in real-time. These analytics take the random nature of changes into account via a control process to speed up the prediction process and provide more accurate predictions.

Patent Selected C.P. Tsokos, A. Saghafi

MACHINE LEARNING ANALYTICS IN REAL TIME FOR HEALTH SERVICES

C.P. Tsokos, A. Saghafi
Patent Selected
About The Publication
15 Oct 2018

Optimal Dose of Intravenous Ketamine to Treat Complex Regional Pain Syndrome

San Francisco, CA, USA

Anesthesiology 2018

Conferences B. Martin, A. Saghafi, J. Alexander, E. Bavry, T. Hanson, R. Schwartzman, A. Kirkpatrick,

Optimal Dose of Intravenous Ketamine to Treat Complex Regional Pain Syndrome

B. Martin, A. Saghafi, J. Alexander, E. Bavry, T. Hanson, R. Schwartzman, A. Kirkpatrick,
Conferences
About The Publication
Background: The safety and efficacy of ketamine to treat complex regional pain syndrome (CRPS) have been demonstrated in controlled studies. However, the optimal dose and duration of treatment with intravenous ketamine have not been determined. The purpose of this study was to develop a method that objectively and continuously measures the clinical benefits of ketamine infusions thus making it possible to determine an optimal dose of ketamine to treat CRPS. Results: Our study developed and validated the use of Pain Thresholds as a method that objectively and continuously measures the clinical benefits of ketamine infusions thus providing information that would lead to a standardized protocol for ketamine infusions with regards to dose and duration of treatment. Our findings suggest that four days of treatment appear to be sufficient for treatment of CRPS of the lower extremities but longer treatment may be required for CRPS of the upper extremities.
31 Aug 2018

On Heredity Factors of Parkinson’s disease: A Parametric and Bayesian Analysis

https://doi.org/10.4236/apd.2018.73004

Advances in Parkinson’s Disease, 7 (3) 31-42.

Journal Paper A. Saghafi, C.P. Tsokos, R.D. Wooten

On Heredity Factors of Parkinson’s disease: A Parametric and Bayesian Analysis

A. Saghafi, C.P. Tsokos, R.D. Wooten
Journal Paper
About The Publication
Hereditary is one of the key risk factors of the Parkinson’s disease (PD) and children of individuals with the Parkinson’s carry a two-fold risk for the disease. In this article, chance of developing the Parkinson’s disease is estimated for an individual in five types of families. That is, families with negative history of the PD (I), families with positive history where neither one of the parents (II), one of the parents (III-IV), or both parents (V) are diagnosed with the disease. After a sophisticated modeling, Maximum Likelihood and Bayesian Approach are used to estimate the chance of developing the Parkinson’s in the five mentioned family types. It is extremely important knowing such probabilities as the individual can take precautionary measures to defy the odds. While many physicians have provided medical opinions on chance of developing the PD, our study is one of the first to provide statistical modeling and analysis with real data to support the conclusions. Keywords: Parkinson’s Disease, Heredity, Bayesian Estimation, Maximum Likelihood, Statistical Modelling.
17 Apr 2018

Improved Parameter Estimation of Time Dependent Kernel Density by using Artificial Neural Networks

https://doi.org/10.1016/j.jfds.2018.04.002

Journal of Finance and Data Science, 4 (3) 172-182.

Journal Paper X. Wang, C.P. Tsokos, A. Saghafi

Improved Parameter Estimation of Time Dependent Kernel Density by using Artificial Neural Networks

X. Wang, C.P. Tsokos, A. Saghafi
Journal Paper
About The Publication
Time Dependent Kernel Density Estimation (TDKDE) used in modelling time varying phenomenon requires two input parameters known as bandwidth and discount to perform. A Maximum Likelihood Estimation (MLE) procedure is commonly used to estimate these parameters in a set of data but this method has a weakness; it may not produce stable kernel estimates. In this article, a novel estimation procedure is developed using Artificial Neural Networks which eliminates this inherent issue. Moreover, evaluating the performance of the kernel estimation in terms of the uniformity of Probability Integral Transform (PIT) shows a significant improvement using the proposed method. A real-life application of TDKDE parameter estimation on NASDQ stock returns validates the flawless performance of the new technique. Keywords: Time Dependent Kernel Density Estimation, Artificial Neural Networks, Probability Integral Transform, Finance, Machine learning.
05 Jun 2017

A Common Spatial Pattern Method for Real-time Eye State Identification by using EEG Signals

https://doi.org/10.1049/iet-spr.2016.0520

IET Signal Processing, 11(8) 936-941.

Journal Paper A. Saghafi, C.P. Tsokos, H. Farhidzadeh

A Common Spatial Pattern Method for Real-time Eye State Identification by using EEG Signals

A. Saghafi, C.P. Tsokos, H. Farhidzadeh
Journal Paper
About The Publication
Cross-channel maximum and minimum is utilized to monitor real-time Electroencephalogram signals in 14 channels. Upon detection of a possible change, Multivariate Empirical Mode Decomposed the last two seconds of the signal into narrow-band intrinsic mode functions. Common Spatial Pattern is then applied to create discriminating features for classification purpose. Logistic Regression, Artificial Neural Network, and Support Vector Machine classifiers all could detect the eye state change with 83.4% accuracy in less than two seconds. Application of the introduced algorithm in the real-time eye state classification is promising. Increasing the training examples could even improve the accuracy of the classification analytics. Keywords: real-time systems, support vector machines, regression analysis, neural nets, electroencephalography, medical signal processing.
15 Apr 2017

Random Eye State Change Detection in Real-Time using EEG Signals

https://doi.org/10.1016/j.eswa.2016.12.010

Expert Systems with Applications, 72 (15) 42-48.

Journal Paper ] A. Saghafi, C.P. Tsokos, M. Goudarzi, H. Farhidzadeh

Random Eye State Change Detection in Real-Time using EEG Signals

] A. Saghafi, C.P. Tsokos, M. Goudarzi, H. Farhidzadeh
Journal Paper
About The Publication
Maximum and minimum computed across channels is used to monitor the Electroencephalogram signals for possible change of the eye state. Upon detection of a possible change, the last two seconds of the signal is passed through Multivariate Empirical Mode Decomposition and relevant features are extracted. The features are then fed into Logistic Regression and Artificial Neural Network classifiers to confirm the eye state change. The proposed algorithm detects the eye state change with 88.2% accuracy in less than two seconds. This provides a valuable improvement in comparison to a recent procedure that takes about 20 minutes to classify new instances with 97.3% accuracy. The introduced algorithm is promising in the real-time eye state classification as increasing the training examples would increase its accuracy. Keywords: Eye state detection, Classification, Multidimensional empirical mode decomposition, Logistic regression, Artificial Neural Network, Support Vector Machine.
27 Feb 2014

Optimization of composite double-walled cylindrical shell lined with porous materials for higher sound transmission loss by using Genetic Algorithm

https://doi.org/10.1007/s11029-014-9394-2

Mechanics of Composite Materials, 50 (1) 71-82.

Journal Paper H. Ramezani, A. Saghafi

Optimization of composite double-walled cylindrical shell lined with porous materials for higher sound transmission loss by using Genetic Algorithm

H. Ramezani, A. Saghafi
Journal Paper
About The Publication
A study on the optimization of sound transmission loss (TL) across a double-walled cylindrical laminated composite shell whose walls sandwich a layer of porous material is investigated using a genetic algorithm. First, an exact relation is presented by considering the effective wave component in the porous layer within the framework of the classic theory for laminated composite shells. The TL of the structure is estimated in a broadband frequency. Then, an acoustic optimization is considered for the sandwich structure with respect to the constraints of geometric properties. Keywords: transmission loss, genetic algorithm, porous media, cylindrical laminate composite shell.
18 Jul 2013

Psycho-social Profile of Iranian Adolescent’s Internet Addiction

https://doi.org/10.1089/cyber.2012.0237

Cyberpsychology, Behavior, and Social Networking, 16(7) 543-548.

Journal Paper K. Ahmadi, A. Saghafi

Psycho-social Profile of Iranian Adolescent’s Internet Addiction

K. Ahmadi, A. Saghafi
Journal Paper
About The Publication
Factors that could play an important role in Internet addiction Iranian high school and secondary school adolescents were examined through a national random sample.
15 Feb 2013

On the Modes of the Poisson Distribution of Order k

Official Publication of the Fibonacci Association

The Fibonacci Quarterly, 51(1) 44-48.

Journal Paper Selected C. Georghiou, A.N. Philippou, A. Saghafi

On the Modes of the Poisson Distribution of Order k

C. Georghiou, A.N. Philippou, A. Saghafi
Journal Paper Selected
About The Publication
We mathematically provided sharp upper and lower bound formulas for the modes of the Poisson distribution of order k. The lower bound established in this paper is better than the previously established lower bound. In addition, for k = 2, 3, 4, 5, a recent conjecture is presently proved solving partially an open problem since 1983.
02 Jan 2013

Estimation of the Weibull parameters by Kullback-Leibler divergence of Survival functions

https://doi.org/10.12785/amis/070123

Applied Mathematics & Information Sciences (AMIS), 7 (1) 187-192.

Journal Paper G. Yari, A.R. Mirhabibi, A. Saghafi

Estimation of the Weibull parameters by Kullback-Leibler divergence of Survival functions

G. Yari, A.R. Mirhabibi, A. Saghafi
Journal Paper
About The Publication
We show that the Kullback-Leibler Divergence of Survival Functions converges to zero with increasing sample size and utilize that to develop a new technique estimating Weibull distribution parameters. Detailed simulations show improved performance of the new estimation method compared to commonly used maximum likelihood and linear regression methods in Weibull scale parameter estimation. Keywords: Kullback-Leibler divergence, Survival function, Weibull distribution, Reliability, Simulation.
29 Aug 2012

A Bayesian approach for modeling ceramic’s fracture strength

Tehran, Iran

Proceeding of the 11th Iranian Statistical Conference, ISC11.

Conferences G. Yari, A.R. Mirhabibi, A. Saghafi, A.F. Farahani

A Bayesian approach for modeling ceramic’s fracture strength

G. Yari, A.R. Mirhabibi, A. Saghafi, A.F. Farahani
Conferences
About The Publication
30 Apr 2012

Unbiased Weibull modulus estimation using Differential Cumulative Entropy

https://doi.org/10.1080/03610918.2011.600498

Communications in Statistics - Simulation and Computation, 41 (8) 1372-1378.

Journal Paper G. Yari, A. Saghafi

Unbiased Weibull modulus estimation using Differential Cumulative Entropy

G. Yari, A. Saghafi
Journal Paper
About The Publication
In 2007, Liu defined a new entropy which measures the distance between a prescribed and an empirical survival function. In this article, we utilize this measure called Differential Cumulative Entropy (DCE) for Weibull parameters estimation. We show that the DCE method provides biased estimations of the Weibull modulus, but utilizing unbiasing factors derived here we enhance the results. A simulation study shows the higher performance of the new method over commonly used maximum likelihood and linear regression methods in Weibull parameters estimation especially in small sample sizes. Keywords: Differential cumulative entropy, Reliability, Simulation, Weibull distribution.
13 Feb 2012

Statistical analysis of flaws in glazed and unglazed ceramic tiles via the Weibull distribution

CASTELLÓN, Spain

The Global Congress on Ceramic Tiles, QUALICER 2012.

Conferences M. Zarabian, B. Eftekhari Yekta, A. Saghafi, V. Jafarniya

Statistical analysis of flaws in glazed and unglazed ceramic tiles via the Weibull distribution

M. Zarabian, B. Eftekhari Yekta, A. Saghafi, V. Jafarniya
Conferences
About The Publication
The three point bending strength of glazed and unglazed tiles was measured. The values of the Weibull parameters were estimated via Linear Regression (LR), Moment (M) and Maximum Likelihood (ML). The LR method showed the minimum Kolmogorov distance, indicating that it was more precise for determining the Weibull parameters. Furthermore, while the characteristic strength and the mean strengths were increased by the glazing, the Weibull modulus was reduced. The strength distributions of the glazed and the unglazed tiles were completely different, i.e. they demonstrated a bimodal and a unimodal distribution, respectively. This behavior was attributed to new flaws originating from the glazing.
11 Jul 2011

A Conjecture on the modes of the Poisson distribution of order k

SIAM

Problems and Solutions, Problem 11-005, SIAM.

Conjecture A.N. Philippou, A. Saghafi

A Conjecture on the modes of the Poisson distribution of order k

A.N. Philippou, A. Saghafi
Conjecture
About The Publication
The problem of deriving the modes of the Poisson distribution of order k was posed by Philippou (1983) and Philippou (1985) but remained open due to complexity. In 1987, Luo derived a sharp upper bound for the modes. Using simulations and pattern recognition, we proposed a closed formula for the modes of the Poisson distribution of order k.
09 Dec 2009

Improved Linear Regression Method for Estimating Weibull Parameters

https://doi.org/10.1016/j.tafmec.2009.09.007

Theoretical and Applied Fracture Mechanics, 52 (3) 180-182.

Journal Paper A. Saghafi, A.R. Mirhabibi, G. Yari

Improved Linear Regression Method for Estimating Weibull Parameters

A. Saghafi, A.R. Mirhabibi, G. Yari
Journal Paper
About The Publication
In the linear regression method for estimating parameters of a Weibull distribution, multiple flaw distributions may be further evidenced by derivation form the linearity of data from a single Weibull distribution.In this paper,a new technique of estimating multiple Weibull parameters is conducted, compared to commonly used regression probability estimator. Keywords: Weibull distribution, Coefficient of determination, Multiple flaw distributions, Fracture strength, Reliability
23 Aug 2006

Gambler’s Ruin Problem

Shiraz, Iran

The 8th Iranian Statistical Conference, ISC8.

Conferences H.D. Hamedani, A. Saghafi

Gambler’s Ruin Problem

H.D. Hamedani, A. Saghafi
Conferences
About The Publication
Keywords: relative wealth, upward rally, downward fall, ruin probability, expected ruin time.
13 Aug 2009

Past Rényi Entropy of Reliability Distributions

Isfahan, Iran

Proceeding of the 7th Seminar on Probability and Stochastic Processes, SPSP7.

Conferences G. Yari, A. Saghafi

Past Rényi Entropy of Reliability Distributions

G. Yari, A. Saghafi
Conferences
About The Publication
Dynamic generalized information measures have a lot of applications in describing nonlinear dynamical and chaotic systems. Residual and past Rényi entropies are two types of this measurement. Recently, Nanda and Maiti have derived expressions for the residual Rényi entropy of twenty six different univariate distributions which are widely used in reliability and survival analysis. In this paper, we have derived expressions for the past Rényi entropy of the latter distributions. Keywords: dynamic information measures, Shannon entropy, past Rényi entropy, reliability.
27 Apr 2009

Prediction of Ceramics Average Strength Using Weibull Statistical Model

Shiraz, Iran

Proceeding of the 7th Iranian Ceramic Congress, ICC07.

Conferences M. Zarabian, B.A. Yekta, A. Saghafi, H. Malaei

Prediction of Ceramics Average Strength Using Weibull Statistical Model

M. Zarabian, B.A. Yekta, A. Saghafi, H. Malaei
Conferences
About The Publication
20 Jul 2006

Gambler’s Ruin Problem: a Relative Wealth Model with Variable Step Probabilities

Paris, France

Proceeding of 31st Conference of Stochastic Processes and their Applications, SPA2006.

Conferences H.D. Hamedani, A. Saghafi

Gambler’s Ruin Problem: a Relative Wealth Model with Variable Step Probabilities

H.D. Hamedani, A. Saghafi
Conferences
About The Publication
We consider a generalization of gambler’s ruin problem in which the gambler decides to quit the game according to his or her relative wealth. The relative wealth is defined by the difference of current wealth and its historical minimum (upward rally) and also the difference of the historical maximum and its current value (downward fall). In our setting, the probabilities of winning, losing, or keeping the current wealth at each step depend on the wealth earned up to the previous step. In this paper, we give the expected ruin time and obtain the probabilities of ruin on the upward rally and downward fall.
.04

TEACHING

MY COURSES
DS 401 - Time Series & Forecasting

DS 401 – Time Series & Forecasting

DS 401 – Time Series & Forecasting

About The Project
Course Description: The course will provide students with basic understanding of time series data and various components that could be present in data gathered through time. Common statistical methods and corresponding theory to model time series data are discussed and practiced with real and simulated data. Model selection and parameter estimation is discussed in conjunction with checking model assumptions. An adequate model is then used to make forecasts. Syllabus. Learning Objectives: 1. Identify and visualize time series data 2. Understand different components of time series data 3. Assess various statistical models and choose an adequate model 4. Perform parameter estimation for selected models 5. Perform model validation and residual analysis 6. Use adequate models for forecasting 7. Simulate time series data 8. Learn to use statistical softwares for time series analysis and forecasting Comment: It took me some time to collect and organize the material and perfect them after teaching the course a couple of times. If you are an instructor, feel free to use the material in your course, please don’t remove my name and credentials from the first slide, you may add yours. For students, dive in and share if you find the stuff useful. PowerPoint Slides & Lectures: Datasets & Codes W1 Time Series Components & Stationarity (Course Intro) (TS Components & Stationarity) (TS Transformations & Box-Cox) (Lab: R Studio & Markdown) (Lab: TS Packages & Plots) (Lab: TS Components & Transformations) W2 Estimating & Removing Trends (White Noise) (Trends & Regression) (Lab: Simulating White Noise & Trends) (Lab: Trend Estimation & Removal) (Moving Average Filtering + Lab) (Differencing + Lab) W3 Estimating & Removing Seasonal Variation (Defining Seasonal Variation) (Estimating Seasonal Variation) (Lab: Simulating Seasonal Variation) (Lab: Estimating & Removing Seasonal Variation Ex1) (Lab: Estimating & Removing Seasonal Variation Ex2) (Lag m Differencing + Lab) (Auto Correlation Function (ACF)) (Lab: Autocorrelogram) W4 Moving Average Time Series (Notations, Sample Vs Population) (ACF of White Noise) (ACF of MA(1)) (ACF of MA(2) & MA(q)) (Lab: Simulating MA(1) & MA(2)) (Lab: Simulating MA(q) & Plotting ACF) W5 Autoregressive Time Series (Random Walk & Its ACF) (AR(1) & Its ACF) (PACF Definition & AR(1) PACF) (AR(2) & its ACF/PACF) (AR(p) & its ACF/PACF) (Lab: Simulating Random Walk & AR(1)) (Lab: Simulating AR(p)) W6 ARFIMA Time Series (Backward-shift Operator) (Characteristic Polynomial) (General Linear Process & Invertibility) (ARMA(1,1) & its ACF/PACF) (ARMA(p,q) & its Properties) (ARIMA & ARFIMA Models) (Lab: Simulating ARMA(1,1)) (Lab: Simulating ARMA(p,q)) (Lab: ARIMA(p,d,q)) (Lab: ARFIMA(p,d,q)) W7 Parameter Estimation & Residual Analysis (Parameter Estimation) (Lab: Example 1) (Lab: More Examples) (Residual Analysis) (Lab: Residual Analysis) (Lab: Residual Analysis Example 2) W8 Cross-Validation & Forecasting (Overview of Model Fitting) (Lab: Model Fitting & Forecasting) (Cross-Validation & Forecasting) (Lab: CV & Forecasting Ex2) (CV & Forecasting Ex3) (Lab: CV & Forecasting Ex3) W9 Time Series in Frequency Domain (Exploring Seasonality in Frequency Domain) (Periodogram) (Lab: Examples) (More Examples) (Lab: Star Brightness Example) (Lab: Sales Example) W10 ARCH & GARCH Models (ARCH & GARCH Intro) (ARCH(1)) (Lab: ARCH/GARCH Models) (ARCH(p) & GARCH(q,p)) (Example DJIA Stocks) (Lab: Gold ETF Returns) (Lab: DJIA Stock Returns) W11 SARFIMA-GARCH Models & Forecasting (Modeling Apple’s daily stock prices) (Lab: Details of Codes)
DS 202 - Intro to Data Science

DS 202 – Intro to Data Science

DS 202 – Intro to Data Science

About The Project
Course Description: Introduce students to data science and equip them with the basic ideas, principles, practices, and challenges of modern data creation, manipulation and analysis. Students will be introduced to high programming language and learn to write basic codes using Python and a variety of packages. Real datasets from a variety of disciplines will be used to make the learning contextual. Learning Objectives: 1. Utilize Python and other tools to scrape, clean, process and analyze data 2. Interact with a variety of data sources including relational databases 3. Manage and analyze big data 4. Apply statistics and computational analysis to make predictions based on data 5. Apply basic machine learning algorithms 6. Apply principles and practices of cooperative teamwork Comment: It took me some time to collect and organize the material. If you are an instructor, feel free to use the material in your course, please don’t remove my name and credentials from the first slide, you may add yours. For students, dive in and share if you find the stuff useful. Week 7 Exploratory Analysis & Regression (Data & Python Codes) (Regression Intro) (Exploratory Charts) (Numerical Summaries) (Lab: Qualitative Vars) (Lab: Quantitative Vars) (Predictor Vs Response Var) (Bivariate Exploratory Analysis) (Lab: Bivariate Qual Summaries) (Lab: Bivariate Quant Summaries) (Lab: Practice Problem) (Regression and SLR) (MLR & GOF Measures) (Lab: MLR using CARMPG dataset) (Lab: MLR using CREDIT dataset) Week 8 Dimension Reduction & Clustering (Data & Python Codes) (Unsupervised Learning Intro) (Exploratory Analysis) (Lab: Numerical Summaries) (Lab: Exploratory Charts 1) (Lab: Exploratory Charts 2) (Dimensinon Reduction) (Lab: Dim Reduction) (Lab: Dim Reduction Example) (K-Means Clustering) (Lab: K-Means Clustering) (Lab: K-Means Clustering Example) Week 9 Classification & Artificial Neural Networks (Data & Python Codes) (Classification Intro) (Exploratory Analysis) (Lab: Exploratory Analysis) (Artificial Neural Networks) (Lab: ANNs Example) (Goodness of Fit Measures) (Lab: Classification Example 1) (Lab: Classification Example 2) (Classification Example 3)
DS 403 - Applied Machine Learning

DS 403 – Applied Machine Learning

DS 403 – Applied Machine Learning

About The Project
Course Description: Various supervised and unsupervised learning theory and algorithms are introduced and practiced with simulated and real data from different disciplines. R and Python codes are provided along with lectures. Learning Objectives: 1. Understanding the basic building blocks and general principles to designing machine learning algorithms 2. Understanding the strengths and weaknesses of different machine learning algorithms 3. Learning methodologies and softwares to apply machine learning algorithms to real data and evaluate their performance 4. Designing machine learning strategies to discover pattern in data and use it to perform forecasting 5. Learning to code and use several machine learning softwares such as R, Python and Weka Comment: It took me some time to collect and organize the material after teaching the course a number of times. If you are an instructor, feel free to use the material in your course, please don’t remove my name and credentials from the slides, you may add yours. For students, dive in and share if you find the stuff useful. PowerPoint Slides: Week 1: Ch0 Introduction and Review Week 2: Ch1 R/Python Introduction Week 3: Ch2 Simple Linear Regression Week 4: Ch3 Multiple Linear Regression Week 5: Ch4 Feature Generation and Model Selection Week 6: Ch4 Bias-Variance Trad-off and Penalized Regression Week 7: Ch4 Extras Week 8: Ch5 Classification Week 9: Ch5 ANN Week 10: Ch5 Multi Class Classification Week 11: Ch6 Decision Trees Week 12: Ch7 Clustering Week 13: Ch7 More Clustering Week 14: Ch8 Dimension Reduction
ST 310 - Intro to Biostatistics

ST 310 – Intro to Biostatistics

ST 310 – Intro to Biostatistics

About The Project
Course Description: Covered subjects include methods for describing data and relationships, probability, discrete and continuous random variables, sampling distributions, confidence intervals and one and two-sample hypothesis tests for means and proportions. Syllabus. Comment: I’ve been teaching this course for over 10 years now and over time learned to make the material interesting to motivate students and help them understand the subject more effectively. I’ve received so many positive feedbacks on the presentation and effectiveness of the discussed subjects recently, so decided to share my material publicly so everyone can benefit from them. If you are an instructor, feel free to use the material in your course, please don’t remove my name and credentials from the slides, you may add yours. For students, dive in and share if you find them useful. PowerPoint Slides & Lectures: 01 Ch1 Part 1 Intro to BioStatistics (Course Intro) (Some Terminology) 02 Ch1 Part 2 Sampling and Design (Sampling Methods) (Experimental Design) 03 Ch2 Part 1 Graphical Representation (Small Quant Data) (Qual Data) 04 Ch2 Part 2 Graphical Representation (Histogram) (Ogive) (Box Plot) 03-04 Excel Lab I (Freq Table Bar Chart) (Grouped Freq Table, Histogram) 05 Ch2 Part 3 Bivariate Graphs (Characteristics of Distributions) (Bivariate Graphs) 06 Ch2 Part 4 Central Measures (Mean Median Mode) (Weighted Mean Midrange) (TI-83 Data Entry) 07 Ch2 Part 5 Spread Measures (Range IQR Variance) (Examples) 05-07 Excel Lab II (Side-by-side Box Plots) (Descriptive Summary) 08 Ch3 Part 1 Combinatorics (Summation and Product) (Permutation) (Combination) 09 Ch3 Part 2 Sets and Set Operations (Membership, Subset) (Union, Intersection) (Difference) 10 Ch3 Part 3 Sample Space and Probability (Sample Space and Events) (Probability Definition) (Axioms of Prob) 11 Ch3 Part 4 Conditional Probability (Conditional Prob) (Independent Events) (Bayes Theorem) (Relative Risk) 12 Ch4 Part 1 Discrete Distributions (Random Variables) (Discrete Distributions) (PMF Characteristics) 13 Ch4 Part 2 Binomial Distribution (Bernoulli Experiments) (Binomial Distribution) (Examples Using Calculator) 14 Ch5 Part 1 Normal Distribution (Normal Curve) (Normal Probability) (Examples Using Calculator) (Normal Percentiles) 15 Ch5 Part 2 Central Limit Theorem (CLT) (CLT Examples) (More Examples) 16 Ch5 Part 3 Empirical and Chebyshev Rules 17 Ch6 Part 1 Confidence Intervals (Introducing CIs) (Z-Intervals) (Examples Using Calculator) 18 Ch6 Part 2 Confidence Intervals (T-Dist and Prob) (T-Percentiles) (T-Intervals) 19 Ch6 Part 3 Confidence Intervals (CI for Proportions) (Examples Using Calculator) (More Examples) (Sample Size for mu) (Sample Size for p) 20 Ch7 Part 1 Testing Statistical Hypothesis (Null and Alternate) (Type I and II Errors) (Alpha and Beta and Error Plot) 21 Ch7 Part 2 Testing Statistical Hypothesis (Acceptance & Rejection Regions) (Testing in Pop Type I & II) (Using Calculator) 22 Ch7 Part 3 Testing Statistical Hypothesis (Testing in Pop Type III) (Examples Using Calculator) (More Examples) 23 Ch7 Part 4 Sample Proportion Inference (Testing for Proportions) (Examples Using Calculator) 24 Ch8 Part 1 Paired Samples T-Test (Paired T-Test) (Examples Using Calculator) (More Examples) 25 Ch8 Part 2 Independent Samples T-Test (Independent T-Test) (Examples Using Calculator) (More Examples) 26 Ch9 Regression Summary (Class Ending Notes)
.05

CONTACT

EMAIL ME

Check out my CV for complete list of professional activities, follow my research on Researchgate and LinkedIn. Do email me if you have a research proposal, I always enjoy discussing new potentials. We also consider doing projects in Geosciences and Data Science through AI-GLOBAL-CONSULTING.COM

error: Content is protected !!